The Shooting Star Candlestick pattern is commonly utilized in the technical analysis of financial markets, and it’s typically considered a bearish indication. This implies that despite the initial victory of buyers pushing the price up during the candle’s duration, sellers finally gained the upper hand and brought it down. This pattern is usually viewed as a pessimistic indicator, pointing towards a potential continuous decline in price.

For an experienced trader, recognizing this pattern can be an incredibly valuable tool for making informed decisions about when to buy and sell assets. As such, spoting this pattern requires a keen eye and lots of practice observing market trends.
At first glance, it might seem difficult to detect shooting star patterns. Fortunately, with enough knowledge and experience, traders can develop an understanding of this indicator and use it effectively in their trading strategies. To get started, consider some key elements of a shooting star:
- The open, low and close are all near the low of the day
- There is a long upper wick
- The overall look should resemble a shooting star
When you understand what these elements mean for your trading strategy and how they fit into broader market trends, you’ll be able to make more educated decisions about when to buy or sell asset classes. Of course, no single indicator alone provides absolute certainty – rather it’s important to combine other technical indicators with this one for more accurate predictions.
With its engaging yet honest tone of voice, Shooting star candlestick appears on the chart is a trusthworthy indication that can be used by experienced traders to inform their investment decisions.
While learning how to read and interpret this indicator takes dedication and practice, using it effectively can help you maximize your returns on capital investments in financial markets.
The Shooting Star Candlestick Pattern: What it is and Why it matters

The shooting star pattern is a common sight in stock charts and is considered a bearish sign by investors and traders. This pattern is created when the stock’s price reaches a new high but then falls back down and closes near the opening price, creating a candle-like shape on the chart with a long wick at the top and a small body at the bottom.
The pattern gets its name from its resemblance to a shooting star shooting across the sky, with a bright light at the top and a tail trailing behind it.
This bearish pattern is important for investors and traders because it can provide valuable information about the stock’s future price movements. For example, if an investor sees a shooting star on a stock daily chart, they may decide to sell the stock before its price decreases further. This can help them avoid losses and potentially even make a profit if they sell at the right time.
However, it’s important to note that the shooting star is not a guaranteed indicator of future price movements.
It’s just one of many technical analysis tools that investors and traders can use to make informed decisions about their stock purchases.
How to Trade An Actual Shooting Star Candle or an Inverted Hammer?

Have you ever seen a “shooting star” pattern in the stock market? If so, you’re not alone! The shooting star candle is one of the most popular candlestick with a long upper wick and can signal a potential price reversal. But what exactly is a shooting star candlestick pattern and how is it formed? In this blog post, we’ll take a closer look at this particular chart formation and explore why traders pay close attention to it.
A inverted hammer pattern is created when prices rise significantly during the day, only to close near or below their opening levels. This causes the formation of a long upper wick that towers above the smaller body of the candle. The shape of this candle resembles a star (hence the name) with its long tail pointing downwards. This type of pattern usually signals potential weakness in an asset’s price and warns investors against buying into it at that point in time.
So why does this type of pattern form? A few possible explanations exist for its occurrence:
- Distribution: When large shareholders want to offload their positions quickly, they tend to drive prices down by selling their stocks in huge amounts. As more sellers enter the market than buyers, prices start to decline, forming a shooting star on charts.
- Reversal from Highs: When an asset reaches new highs but then fails to sustain them, prices may reverse sharply as buyers are reluctant to purchase at these levels. This can also result in a shooting star and inverted hammer formation.
- False Breakout: Many traders tend to buy when prices break out from a range or trendline but if the breakout turns out to be false, they may end up incurring losses while those who shorted benefit from it; thus creating a candlestick pattern on the chart.
To summarize, understanding how shooting stars form can help you recognize important trends or reversals within your portfolio; potentially helping you stay ahead of other investors and make informed decisions about when to buy or sell an asset. After all, knowledge is power!
Trade The Shooting Star (Shooting Star Trading Strategy)

Traders often use the shooting star pattern as a key tool in their trading strategy. This reversal pattern is considered bearish, so when it is identified on a stock chart, traders may decide to sell the stock before its price decreases further. This can help them avoid losses and potentially even make a profit if they sell at the right time. In addition to the shooting star , traders may also use other technical indicators to make trading decisions.
For example, they may use moving averages to identify trends in the market, or the relative strength index to measure the stock’s momentum. By using a combination of technical indicators, traders can gain a more comprehensive view of the market and make more informed trading decisions.
One of the potential benefits of using the shooting star is its ability to identify potential reversals in the market. When the chart pattern is identified, it may signal that the stock’s price is likely to decrease in the future. This can provide valuable information to traders, allowing them to take advantage of opportunities to sell the stock and potentially make a profit.
It is not always easy to predict the movements of the markets, however, some traders have found success in using technical indicators such as the bearish reversal candlestick pattern. This shooting star candlestick formation can be used to identify potential reversals in the market, allowing traders to capitalize on these opportunities and potentially maximize their profits.
So what is a body of the shooting star? It is a type of candlestick formation that typically occurs at the top of an uptrend or overall downtrend. The hammer candlestick pattern consists of one long candle followed by three small candles which all close lower than the open price of the first candle. This indicates that buyers are losing steam and selling pressure is increasing, thus creating a possible reversal point in the market.
Traders use this pattern as an indication that prices may be due for a pullback or reversal from their current trend. To confirm this signal, they usually look for confirmation from other indicators such as moving averages or momentum oscillators. Once they have identified a potential reversal point, they can then use these signals to enter their trades and benefit from any changes in market direction.
There are several benefits to trading with the close of the shooting star; it can help identify potential reversals and help traders stay ahead of shifting market trends before they become too severe or cause large losses.
Furthermore, it’s an easy strategy to apply since all it takes is one glance at a chart and identifying whether or not there’s a shooting star formation present – making it ideal for those who don’t have much experience in monitoring multiple technical indicators at once.
Lastly, by combining this strategy with other indicators like moving averages and momentum oscillators traders may be able to gain an even better insight into when exactly prices are likely to reverse direction – giving them an edge over others who may not be aware of these subtle yet powerful signals generated by these inverted hammer
The Limitations of Shooting Star Candle Pattern!
The Shooting Star candlestick is a popular charting technique used by traders to measure sentiment and spot changes in the market. But like all indicators, it has drawbacks. To get an accurate read on the market, traders must be aware of some of the limitations of using this pattern, including its subjectivity and the need to combine it with other indicators.
To understand why this pattern is subjective, we first have to look at what a shooting star formation looks like: A small real body near the top of a long upper shadow that’s at least two times as long as its body.
This indicates that buyers initially drove prices higher but were unable to sustain those gains due to strong selling pressure. However, this interpretation can vary depending on how traders interpret them and whether or not they should take action based on their findings.
Another limitations of the pattern is its subjectivity. Because the shooting star reversal pattern is based on the visual interpretation of a stock chart, different traders may have different opinions on whether a particular candlestick body is a potential shooting star or not. Another limitation of the shooting star pattern is that it is not a guaranteed indicator of future price movements.
Just because a shooting star candlestick signifies is identified on a stock chart, it doesn’t mean that the stock’s price will definitely decrease in the future. There are many other factors that can affect a stock’s price, such as market conditions, economic news, and company performance.
Additionally, the shooting star is typically used in combination with other technical indicators. This is because no single indicator can provide a complete picture of the market. By using a combination of indicators, traders can gain a more comprehensive view of the market and make more informed trading decisions.
Overall, while the shooting star can be a useful tool for traders, it is important to recognize its limitations and use it in combination with other indicators. This can help traders make more informed and accurate trading decisions.
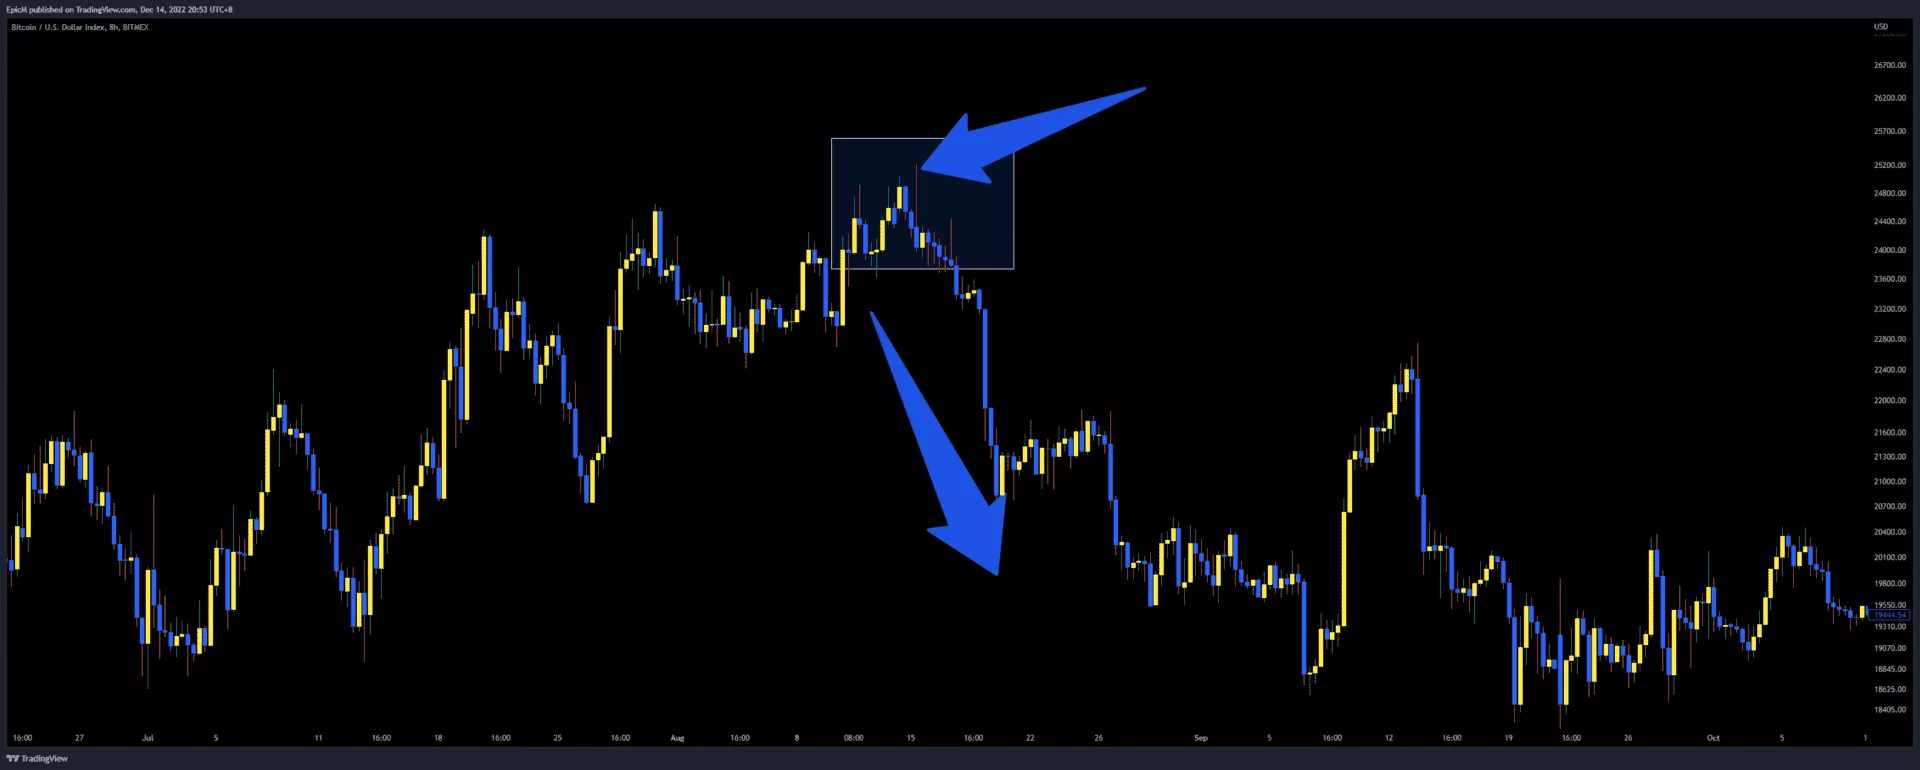
Example of a Shooting Star Trading?
Conclusion: Learn How to trade Pattern that Forms a Bearish Reversal or Trend Reversal Today!
In conclusion, the shooting star pattern gives a bearish sign often seen in stock charts. It is created when the stock’s price reaches a new high but then falls back down and closes near the opening price, creating a candle-like shape on the chart with a long wick at the top and a small body at the bottom.
This pattern can provide valuable information to investors and traders about the stock’s future price movements. However, it’s important to recognize the limitations of the shooting star pattern and use it in combination with other technical indicators for more accurate predictions. Overall, the shooting star pattern can be a useful tool for analyzing stock charts and making investment decisions.